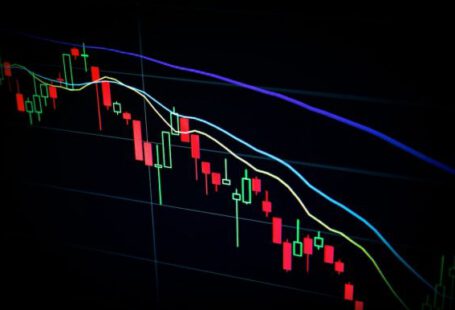
Charting tools are an essential part of any trader’s arsenal. They provide valuable insights into market trends and help traders make informed decisions. In this article, we will explore how to effectively use charting tools in trading.
Understanding Chart Types
The first step in utilizing charting tools is to understand the different types of charts available. The most common types include line charts, bar charts, and candlestick charts. Each chart type has its advantages and is used to visualize different aspects of market data.
Line charts are simple and provide a clear representation of the overall trend. They connect the closing prices of an asset over a specific period. Bar charts, on the other hand, display the open, high, low, and closing prices of an asset. They provide more detailed information and are often used for technical analysis.
Candlestick charts are widely used by traders due to their ability to display the relationship between opening and closing prices. The body of the candlestick represents the price range between the open and close, while the upper and lower shadows show the high and low prices, respectively.
Identifying Support and Resistance Levels
One of the primary uses of charting tools is to identify support and resistance levels. Support levels are price levels at which an asset tends to stop falling and starts to rise, while resistance levels are price levels at which an asset tends to stop rising and starts to fall.
By analyzing historical price data, traders can identify these levels and use them as a basis for their trading decisions. Support and resistance levels can act as turning points in the market, indicating potential buying or selling opportunities.
Utilizing Technical Indicators
Charting tools also provide a wide range of technical indicators that can be used to analyze market trends and predict future price movements. These indicators are mathematical calculations based on historical price data.
Common technical indicators include moving averages, relative strength index (RSI), and Bollinger Bands. Moving averages help smooth out price fluctuations and identify trends. RSI measures the strength and speed of price movements, indicating overbought or oversold conditions. Bollinger Bands show the volatility of an asset and can help identify potential breakouts.
Applying Trend Lines
Trend lines are another powerful tool provided by charting software. They help identify the direction of the market and can be used to determine potential entry and exit points. Trend lines are drawn by connecting a series of higher lows in an uptrend or lower highs in a downtrend.
When the price approaches a trend line, it can act as support or resistance, providing traders with a potential buying or selling opportunity. Trend lines can also help confirm the strength of a trend and indicate when it might be reversing.
Monitoring Multiple Timeframes
Lastly, charting tools allow traders to monitor multiple timeframes simultaneously. This is important because different timeframes can provide different perspectives on market trends. For example, a daily chart might show a bullish trend, while a 15-minute chart might indicate a short-term reversal.
By analyzing multiple timeframes, traders can make more informed decisions and increase their chances of success. It is essential to align the analysis across different timeframes to ensure consistency in trading strategies.
In conclusion, charting tools are invaluable for traders looking to gain an edge in the market. By understanding different chart types, identifying support and resistance levels, utilizing technical indicators, applying trend lines, and monitoring multiple timeframes, traders can make more informed decisions and improve their trading outcomes. So, whether you are a beginner or an experienced trader, make sure to leverage the power of charting tools to enhance your trading skills and increase your chances of success.


