Trading in the financial markets can be a complex and challenging endeavor. With so many variables and factors to consider, it’s no wonder that traders often turn to various tools to help them make informed decisions. In this article, we will demystify some of the most commonly used trading tools and explain what you need to know about them.
Moving Averages: Gauging Trends
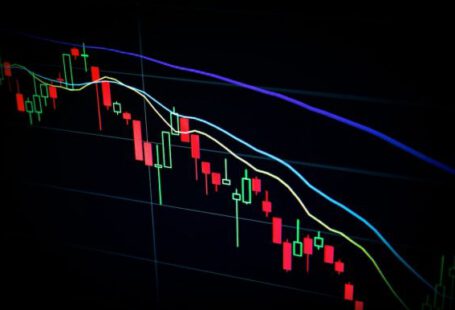
One of the most basic yet powerful tools in a trader’s arsenal is the moving average. A moving average is a line that represents the average price of a security over a specific period. It helps traders identify trends and potential reversals in the market.
There are different types of moving averages, such as simple moving averages (SMA) and exponential moving averages (EMA). The SMA gives equal weight to each data point in the calculation, while the EMA places more weight on recent data. Traders often use moving averages to determine support and resistance levels and to generate buy or sell signals.
Relative Strength Index (RSI): Measuring Momentum
The relative strength index (RSI) is a popular momentum indicator that measures the speed and change of price movements. It helps traders identify overbought or oversold conditions in the market, which can indicate potential reversals.
The RSI ranges from 0 to 100, with readings above 70 signaling overbought conditions and readings below 30 suggesting oversold conditions. Traders can use the RSI to confirm trends or generate buy or sell signals when it diverges from price action.
Bollinger Bands: Volatility and Price Levels
Bollinger Bands are a technical analysis tool that consists of a middle band, an upper band, and a lower band. The middle band is typically a simple moving average, while the upper and lower bands represent a certain number of standard deviations from the middle band.
Bollinger Bands help traders gauge volatility and identify potential price levels. When the price is at the upper band, it may indicate that the security is overbought, while prices at the lower band may suggest oversold conditions. Traders can also look for price breakouts when the bands widen or tighten.
Fibonacci Retracement: Predicting Price Levels
Fibonacci retracement is a tool based on the Fibonacci sequence, a series of numbers where each number is the sum of the two preceding ones. Traders use Fibonacci retracement levels to identify potential support and resistance levels in the market.
The most commonly used Fibonacci retracement levels are 38.2%, 50%, and 61.8%. These levels are drawn on a chart to highlight areas where the price may reverse or consolidate. Traders often combine Fibonacci retracement with other technical indicators to increase the accuracy of their predictions.
Conclusion: Tools for Informed Trading
Trading tools can provide valuable insights and help traders make informed decisions in the financial markets. Moving averages help identify trends, while the RSI measures momentum. Bollinger Bands gauge volatility, and Fibonacci retracement predicts price levels.
It’s important for traders to understand how these tools work and how to interpret their signals. Each tool has its strengths and weaknesses, and combining them with other analysis techniques can lead to more accurate trading decisions.
Ultimately, successful trading requires a combination of skill, knowledge, and experience. By demystifying these trading tools and understanding their applications, traders can enhance their ability to navigate the markets effectively and increase their chances of success.


